In less than ten weeks, WhyData’s Ability 1.0 Service Experience Analytics platform uncovered over $28 million in cost savings for this top ten US Bank.
Executive Summary: This case study reports the results of a WhyData Ability 1.0 analytic software engine deployment at a top ten U.S. bank. The bank had problems of high cost of customer acquisition; high customer churn; and suboptimal customer experience. Past improvement attempts failed to resolve the problems. As part of the WhyData evaluation, the bank ran a double blind experiment by simultaneously contracting the same project with a top three consulting firm. WhyData’s Ability 1.0 solution delivered superior results in a shorter time with a smaller budget. Ability 1.0 Analytics solution is a framework of methods (The Kano Quality Model, The Service Profit Chain Model, and The Serv Qual Model) that analyze the impact of service efficiency on profitability. Results from the WhyData deployment included projected annual savings of over $28,000,000 related to reducing flaws in the Account Openings Process. Customer feedback was quite positive.
The client is one of the ten largest banks in the U.S. For confidentiality purposes, the name of the client is withheld. What can be said is that the bank, a Fortune 500 Company, is one of the most widely recognized brands in America and one of the largest banks by deposit size. It serves banking customers through its primary branch locations in New York, New Jersey, Texas, Louisiana, Maryland, Virginia, and Washington DC. The bank offers a broad variety of financial services and products to consumers, small business and commercial clients. Since the early 1980’s, the bank’s Information Based Strategy has supported its rapid growth and is widely recognized for its innovative approach to analytics and information.
The problems at the bank: High cost of customer acquisition; high customer churn; suboptimal customer experience. Banks invest in marketing and advertising to attract new customers, and the average cost to acquire a new banking customer at this particular bank is estimated to be $450. The average annual customer attrition rate or “churn” is 20%, and a 20% customer churn rate equates to approximately $20 billion of balances and nearly $400 million of profit. Reducing the cost to acquire a new customer and reducing the churn rate have a direct affect on profitability. The bank believes that a more satisfying customer experience will reduce the churn and increase client tenure.
Past improvement attempts came up short: This particular bank tried numerous strategies in the past to address these problems. For example, in the past three years, the bank invested in an internally developed Customer Experience Management platform and a Business Process Re-Engineering Program that werenot very successful in improving the customer experience. The company also tried an Excel-based database tracking system. After spending tens of millions of dollars over three years, these efforts did not deliver the desired results or the financial benefits expected.
The bank tries a double blind experiment: For this program, the bank contracted with two different providers to develop a solution for these problems. The bank’s COO/EVP asked the WhyData team to develop an end-to-end customer experience management (CEM) platform for the bank. In parallel, he set up a separate project using the same criteria with one of the top three consulting firms. Each firm had no knowledge of the other’s involvement with the bank.
WhyData’s analytics solution is a framework of methods that analyze the impact of service efficiency on profitability. WhyData’s system is based on 30 years of research in service science. The methods used validate gaps before significant investments are made in process improvements. WhyData patents include a system that embeds its own intellectual property inclusive of the following models:
- Serv Qual: The Serv Qual model measures five attributes of service variability using a consistent, common language to gain insight on high value or low value activities. Activities include people, process, policies and technology.
- Kano: Kano is a Japanese model for quality that measures service quality on three characteristics; is it a unique service, a competitive service, or an expected service? Depending on the time and pricing model, a business will generate more profit for a unique service than for an expected service. Understanding the organization’s position relative to perceived value is important to avoid one’s services becoming commodity offerings.
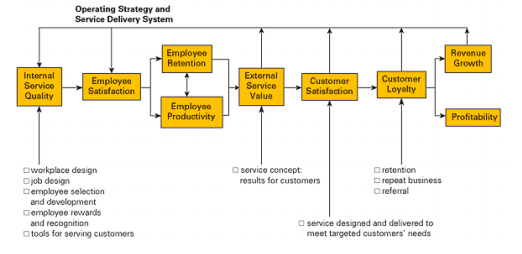
- Service Profit Chain: A way to lay out employee engagements from a process standpoint, customer engagements from a feedback standpoint, and Business Process Indicators (BPIs) from a metrics standpoint. A graphic of the Links in the Service-Profit Chain is shown below.
WhyData Outputs: The WhyData analytics engine provides user-friendly graphical outputs including the following representative reports and charts.
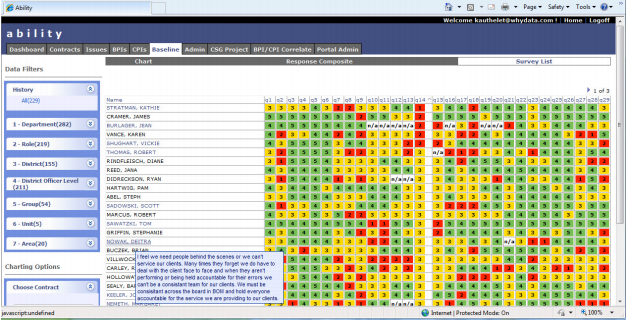
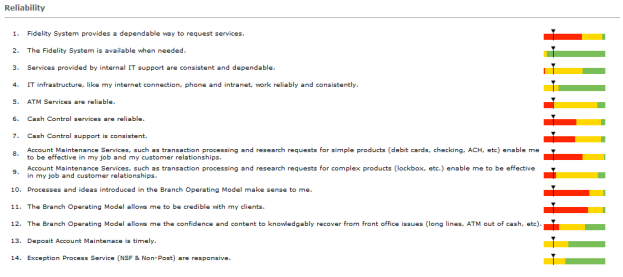
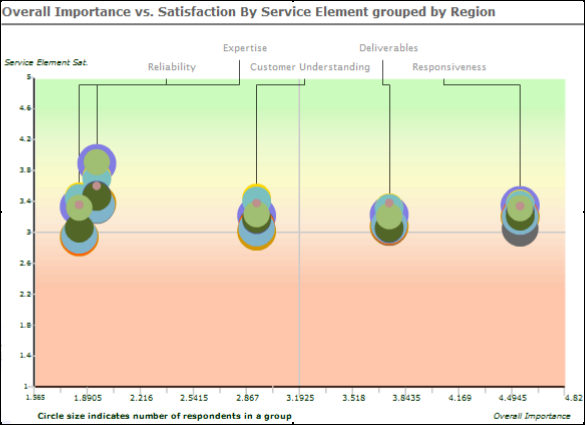
Checkerboard Report : Tornado Report : Bubble Chart
Checkerboard Report
Tornado Report
Bubble Chart (similar to magic quadrant)
The WhyData deployment took only three months: A working “Software as a Service” Customer Experience Measurement (CEM) system was up and running in 3 months, providing compelling baseline information through a visual dashboard display that was easy to use, automated, and provided monitoring capabilities.
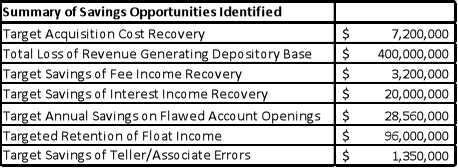
Results from the WhyData deployment included projected savings of over $28,000,000 related to reducing flaws in the Account Openings Process. There were more than seven areas of significant savings identified as shown in the table below.
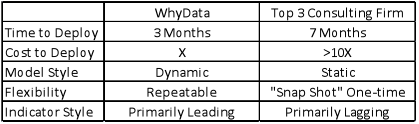
Results of the double blind experiment: When compared to the Top 3 consulting firm’s results, the WhyData Solution fared quite well as indicated in the table below.
Customer feedback was positive: The WhyData tools helped illustrate where to find revenue gains and where to cut costs, while actually improving customer service at the same time. According to the bank’s EVP of Marketing and Shared Services, he felt like he had just been given the equivalent of an enterprise customer experience warning system like the Doppler radar system used to watch hurricanes and tornadoes brewing. “Our teams at the bank couldn’t see these kinds of near-real time insights even after years of manual and expensive forensics.”
“WhyData’s Solution is accretive, bringing more value and benefit the more you use it. Conservatively, the WhyData platform uncovered a $28 million opportunity for the BANK in almost the blink of an eye, by traditional measures. It is highly reusable and automated. These intelligent and learning software tools allowed us to gain statistically valid insights into our allocation of human and capital resources, while maintaining and actually improving our level of customer experience.”
“The savings fall into two major buckets. The first is the operational service delivery costs, which can often be a billion dollars for the size of the Top Ten Bank. The other is the ongoing metrics management cost for outsourced surveys, survey management, customer complaint feedback and more manual efforts. These costs can run $25 to $50 million or more for a large regional bank. Again, using a conservative 2% savings benefit, we can see that the WhyData tools help both the numerator (increased revenue) and the denominator (lower costs) in the profit equation.”
